Contact

Reports your managers and donors actually read.

Data cleaning, survey analysis, dashboards, KPI and M&E reports. We turn the numbers you already collect into one clear page that shows what’s on track and what needs attention.

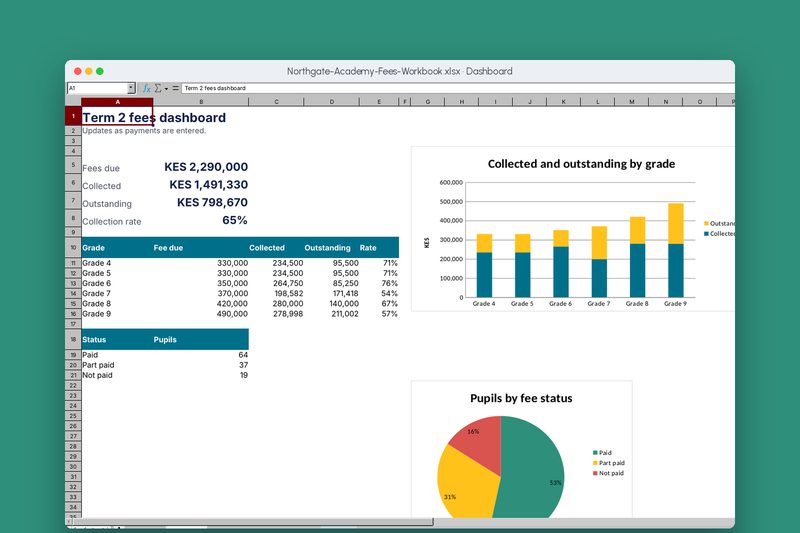
The fees dashboard in the Northgate Academy workbook. Real file, synthetic data.

Done properly, and handed over in full.

  • One clean dataset. Duplicates removed, names and places fixed, and every change recorded.
  • Indicators against targets. Each number shown next to what it should be, with a clear status.
  • Reports that match. Dashboard, tables and narrative all drawn from the same data.
  • Personal data protected. Only totals shared, in line with Kenya’s Data Protection Act.

Organisations we build this for

  • NGO programme and M&E teams
  • Boards and senior managers
  • Researchers and consultants
  • Sales and operations teams
  • Schools tracking results
  • County and public programmes

What’s included

Data cleaning

Messy exports, duplicate records and inconsistent spellings turned into one reliable table.

Survey analysis

Frequencies, cross-tabs and charts with a short written summary of what the data says.

Dashboards

Power BI, Looker Studio or Excel dashboards that refresh from your data.

M&E and donor reports

Logframe indicators, disaggregation and report templates that fill themselves.

Data collection

KoboToolbox, ODK or Google Forms set up with checks, so data arrives clean.

Training

Your team learns to refresh, filter and read the dashboard on their own.

Packages and prices

Prices in Kenya shillings. Your written quotation confirms the exact scope before we start.

Data clean-up

One messy dataset turned into a clean, documented table.

From KES 15,000starting price

  • Up to 5,000 records
  • Duplicates and errors fixed
  • Change log of every correction

5 days delivery2 rounds of changes

Choose Data clean-up

Dashboard

A one-page dashboard that refreshes from your data.

From KES 40,000starting price

  • Up to 12 indicators
  • Filters by place, period and group
  • Power BI, Looker Studio or Excel
  • Training session

14 days delivery3 rounds of changes

Choose Dashboard

Monthly reporting

We prepare your monthly or quarterly report for you.

KES 12,000per month

  • Data refresh and checks
  • Updated dashboard
  • Two-page summary of what changed

Monthly1 round of changes

Choose Monthly reporting

Need something between packages? We’ll quote it. Compare every price.

A demonstration you can walk through

NGO · Data and reporting

Riverbend Community Trust reporting dashboard

Survey data from field officers’ phones feeds a cleaned dataset, a one-page dashboard and a donor report template. Indicators are tracked against targets by county, so managers see what is behind before the quarter ends.

  • KoboToolbox
  • Power Query
  • Power BI
  • Word report template

Read the case studyFictional client

Questions about data and reporting

Which tool should we use for dashboards?

If your team lives in Excel, we build there. If you need sharing with many people online, Power BI or Looker Studio. We’ll recommend one in the quotation.

Can you analyse survey data we already collected?

Yes. Send a sample with personal details removed and we’ll quote for cleaning and analysis.

Do you write the report narrative?

We write a short summary of what the data shows. Programme context and stories stay with your team.

How do you handle personal data?

We work on the minimum data needed, keep it encrypted, and delete our copies when the project ends.

Other services

Tell us what you need. We’ll send a written quotation.

We reply on WhatsApp within two working hours, Monday to Saturday. The first call is free.

WhatsApp us